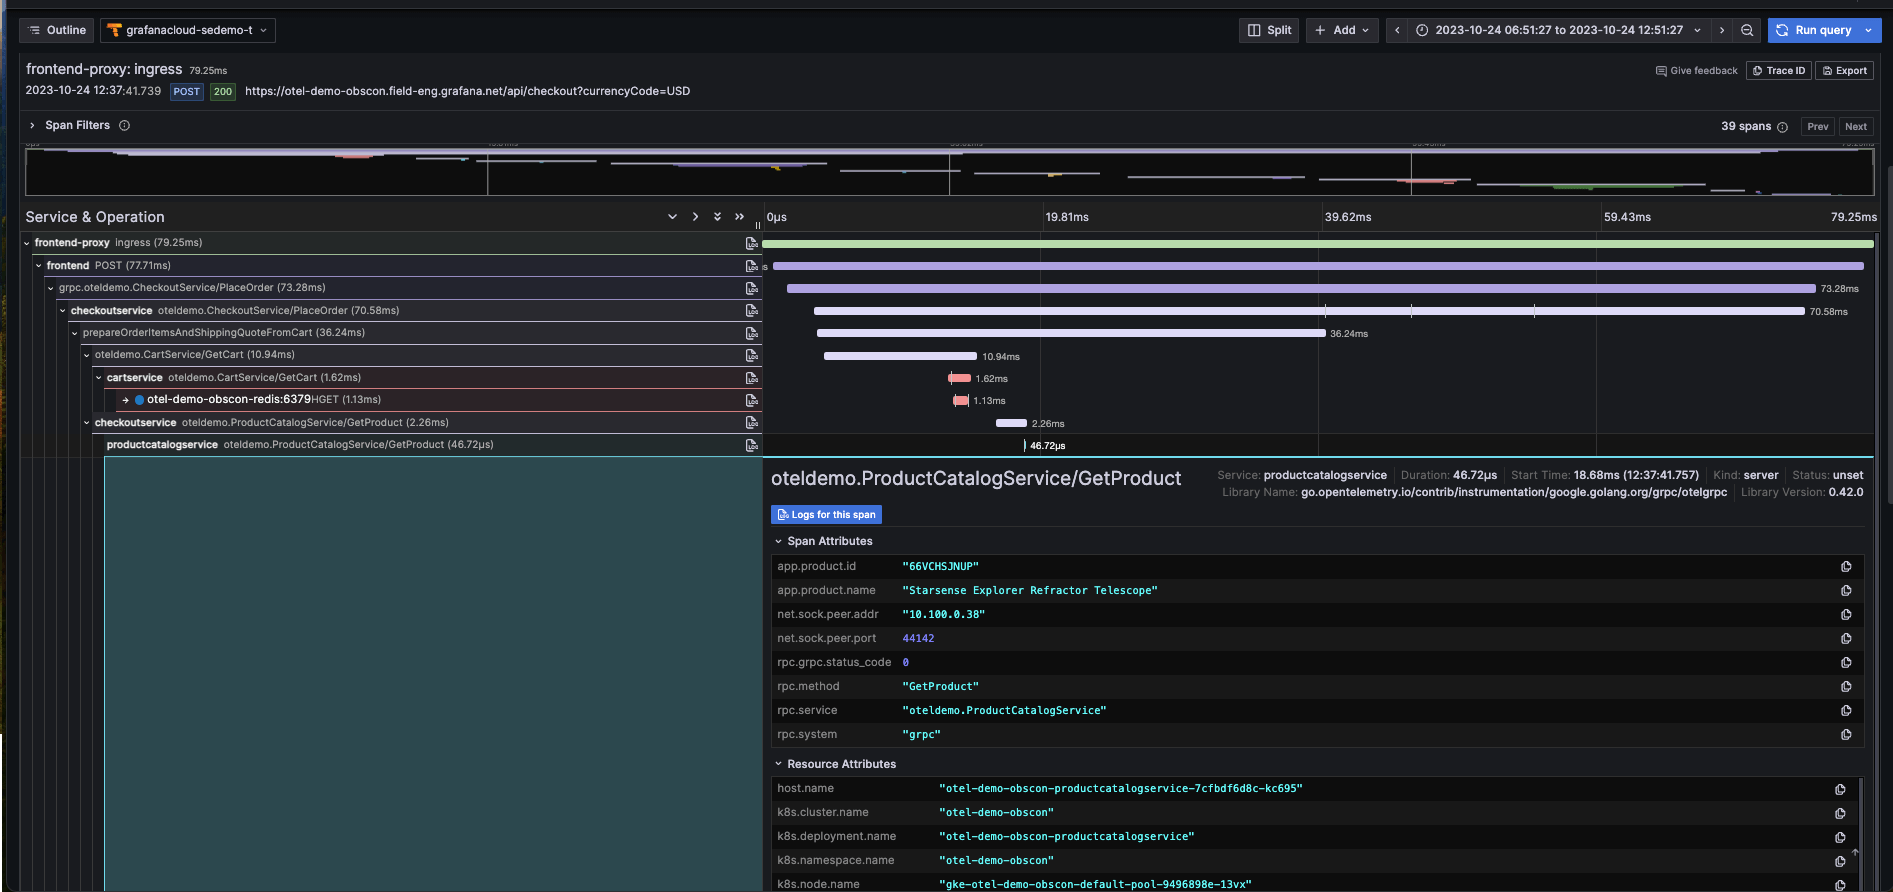
Distributed tracing system for better application performance
Grafana Cloud Traces is a fully managed distributed tracing system powered by Grafana Tempo. Use its highly scalable, cost-effective trace storage and query engine to understand the flow of requests and data in your software systems and track down issues quickly.
The actually useful Grafana Cloud Free plan
Unravel microservice architectures
Pinpoint a problematic service so you know exactly what to fix and who should fix it. View upstream and downstream connections to understand the ripple effects across your system.
Minimal changes, maximum compatibility
Compatibility with OpenTelemetry, Jaeger, and Zipkin trace formats makes it easy to get started, with minimal changes to application instrumentation. Or use OpenTelemetry’s auto-instrumentation to get traces without adding any new code.
Automatic metrics for immediate insights
Request rate, error rate, and latency metrics can be automatically derived for your services. Understand overall system health at a glance, and get alerts when something goes wrong.
Why use Grafana Cloud’s distributed tracing system?
Find specific traces related to performance issues
With Tempo’s powerful query language, TraceQL, Cloud Traces enables you to ask sophisticated questions about how your services are related, turning large swaths of tracing data into actionable insights.
- Filter your traces by duration, status, service, and arbitrary attribute with support for regular expressions, boolean logic, and pattern matching.
- Search traces based on their structure to understand sibling, parent-child, and ancestor-descendant relationships among services.
Correlate traces with metrics and logs to find root cause faster
Pivot between observability signals thanks to Grafana Cloud’s tightly integrated stack, which brings together metrics, logs, and traces with Grafana visualizations.
- Jump from metrics to logs to traces without losing context by leveraging Grafana correlations, exemplars, and data links.
- Generate metrics from your trace data so you can monitor high-level RED signals on application performance and see a map of your services.
Get started with tracing with minimal effort
Grafana Cloud Traces is fully compatible with open source tools and standards, making it easy to adopt.
- Send spans from your applications via Grafana Agent or the OpenTelemetry Collector. OpenTelemetry, Jaeger, and Zipkin trace formats are all supported.
- Build dynamic Grafana dashboards and visualizations from your traces.
- Explore your traces with TraceQL, which is OpenTelemetry-native and shares design principles with PromQL and LogQL.
Performance at scale, with costs under control
Tracing data volumes can climb quickly, especially for complex, microservices-based systems dealing with heavy request traffic. Architected as a cloud native, horizontally scalable system, Cloud Traces handles this seamlessly, in a cost-effective way.
- Cloud Traces leverages object storage and a columnar trace storage format based on Apache Parquet, making it extremely cost-effective.
- Using a massively parallel query engine, Cloud Traces can scan terabytes of traces per second, meaning searches complete in record time.
Not ready for a fully hosted cloud-based observability solution?
Grafana Tempo
Open source, horizontally scalable, highly available, multi-tenant distributed tracing database.
Grafana Enterprise Traces
Self-hosted tracing database that delivers the same exceptional performance, scalability, and cost-efficiency as Grafana Tempo, but adds essential enterprise-grade features and support from Grafana Labs.


