Plugins 〉Redis
Redis
Redis Data Source for Grafana

Introduction
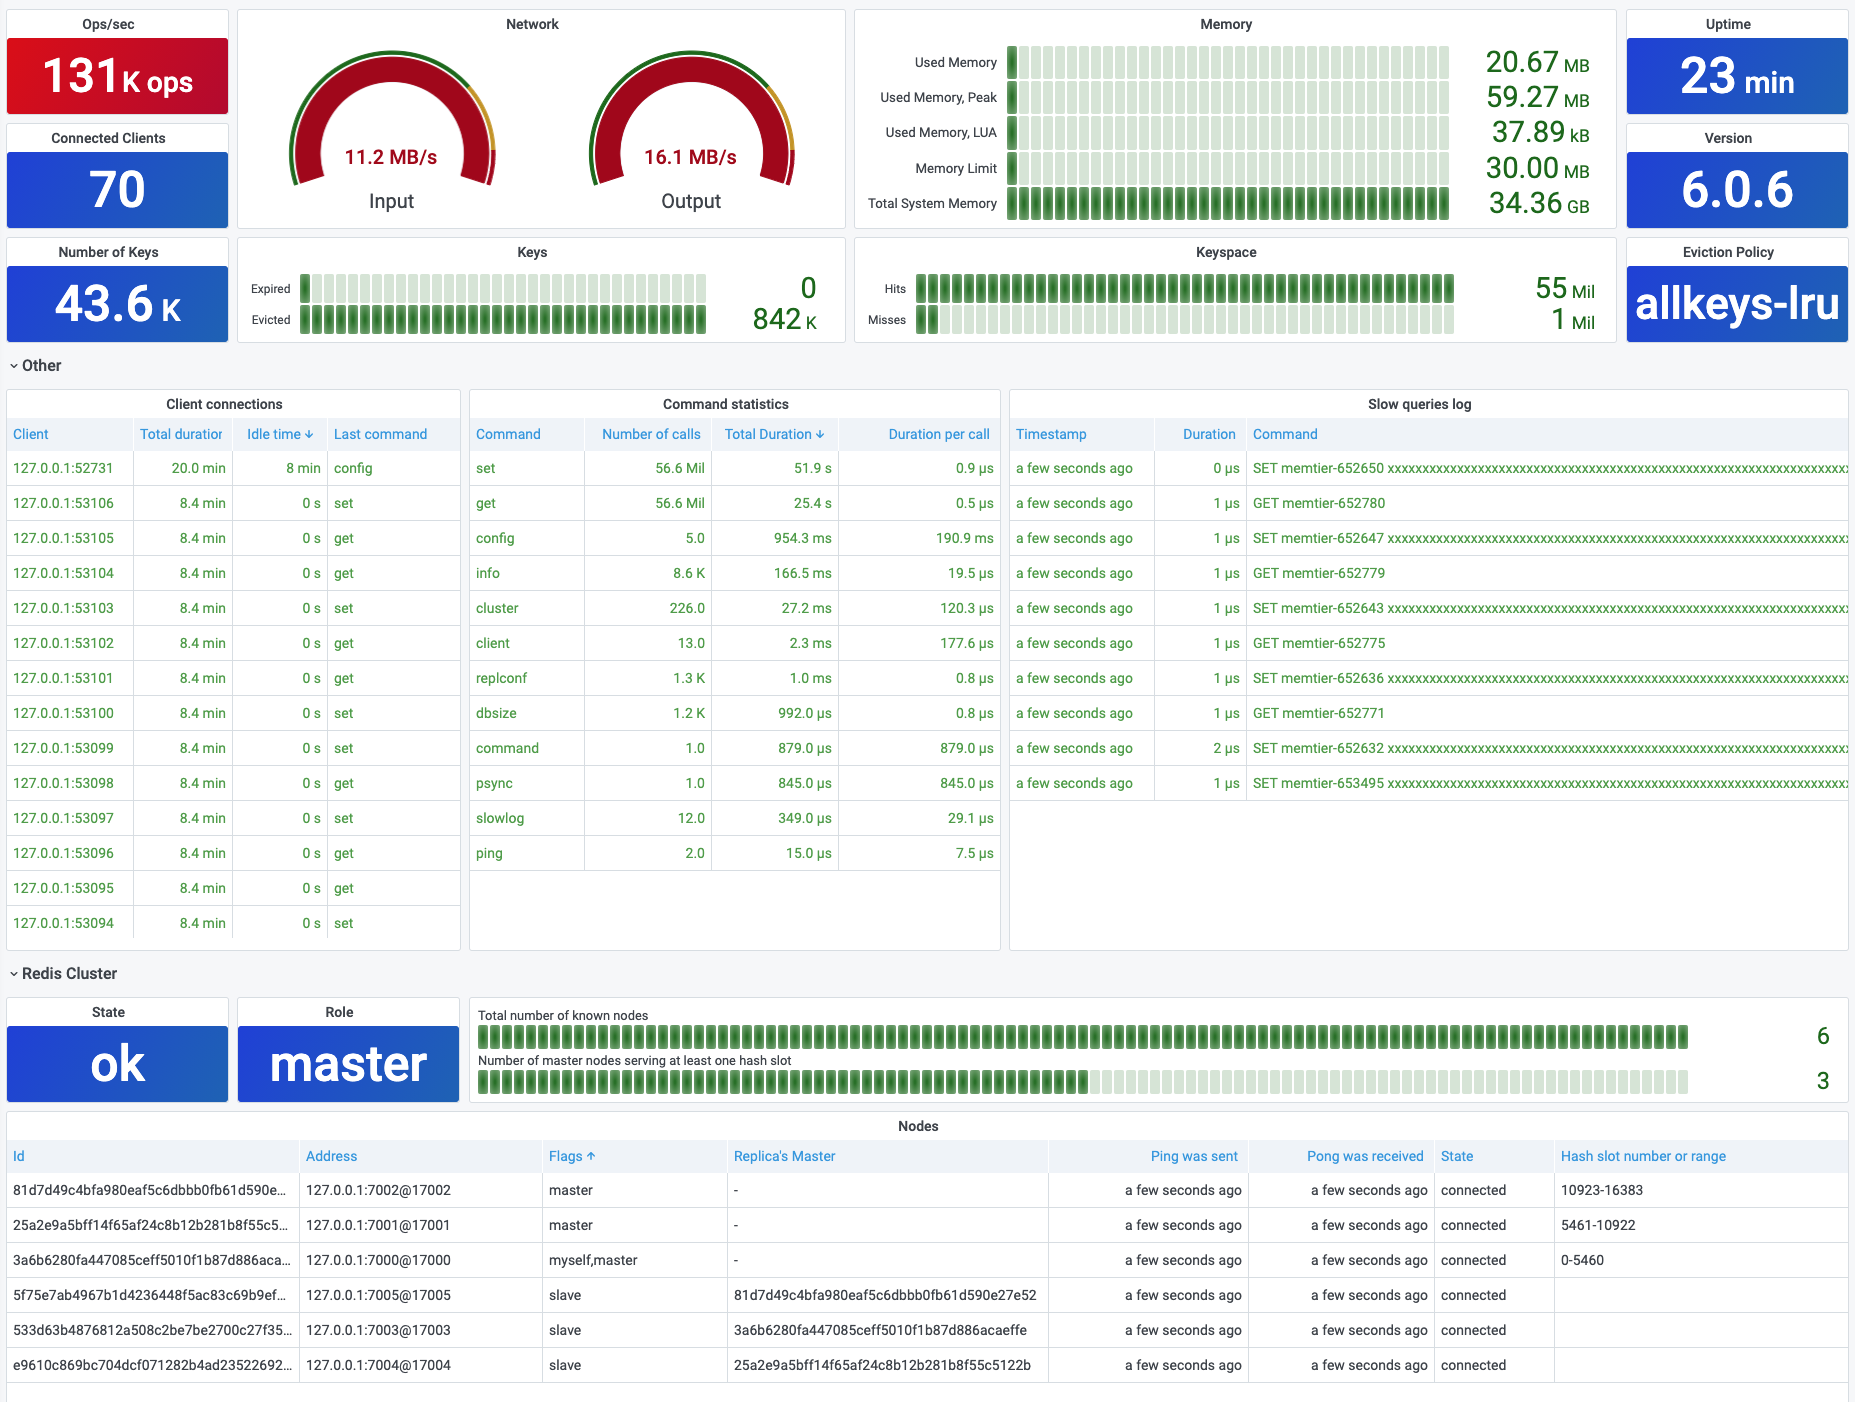
The Redis Data Source for Grafana is a plugin that allows users to connect to any Redis database On-Premises and in the Cloud. It provides out-of-the-box predefined dashboards and lets you build customized dashboards to monitor Redis and application data.
Demo
Demo is available on demo.volkovlabs.io:
Requirements
- Grafana 8.0+ is required for Redis Data Source 2.X.
- Grafana 7.1+ is required for Redis Data Source 1.X.
Redis Application plugin
You can add as many data sources as you want to support multiple Redis databases. Redis Application plugin helps manage various Redis Data Sources and provides Custom panels.
Redis Explorer plugin
The Redis Explorer plugin connects to Redis Enterprise software clusters using REST API. It provides application pages to add Redis Data Sources for managed databases and dashboards to see cluster configuration.
Getting Started
Redis Data Source can be installed from the Grafana Marketplace or use the grafana-cli tool to install from the command line:
grafana-cli plugins install redis-datasource

For Docker instructions and installation without Internet access, follow the Quickstart page.
Configuration
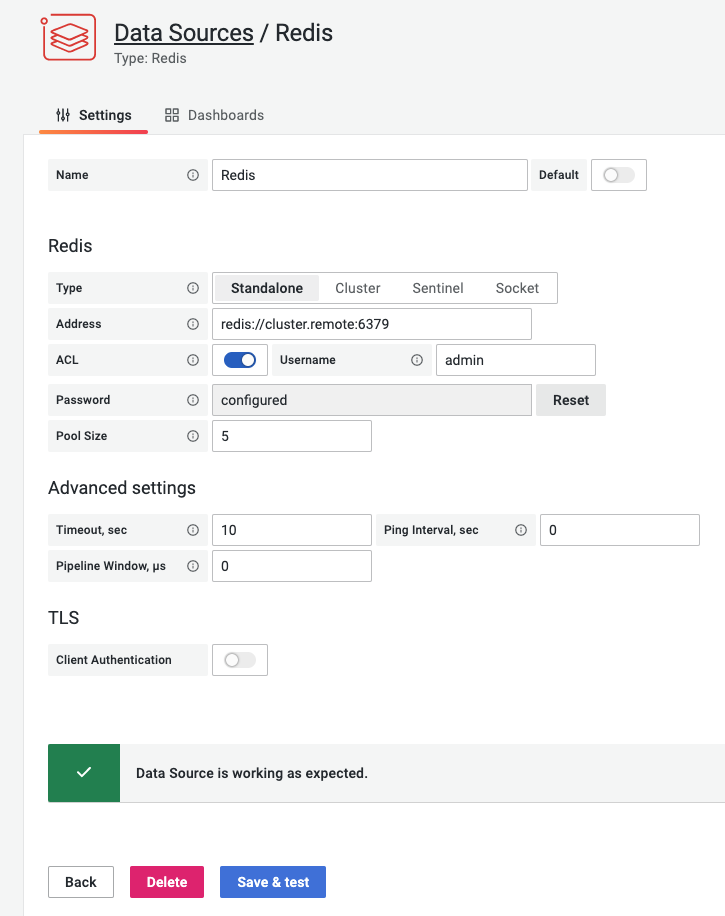
Data Source allows to connect to Redis using TCP port, Unix socket, Cluster, Sentinel and supports SSL/TLS authentication. For detailed information, take a look at the Configuration page.

Documentation
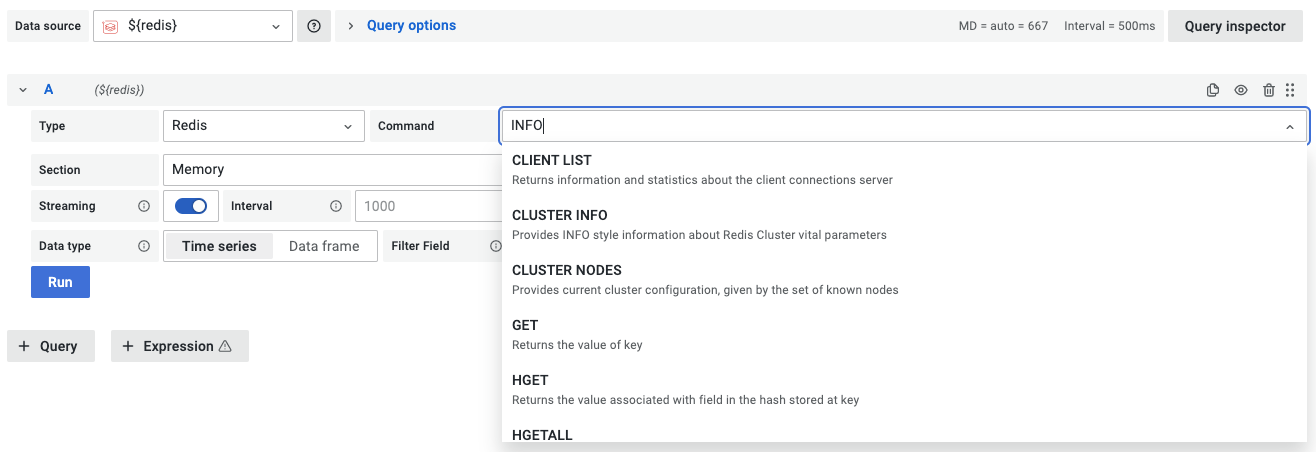
Please take a look at the Documentation to learn more about plugin and features.
Supported commands
List of all supported commands and how to use them with examples you can find in the Commands section.

Development
Developing Redis Data Source page provides instructions on building the data source.
Are you interested in the latest features and updates? Start nightly built Docker image for Redis Application plugin, including Redis Data Source.
Feedback
We love to hear from users, developers, and the whole community interested in this plugin. These are various ways to get in touch with us:
- Ask a question, request a new feature, and file a bug with GitHub issues.
- Star the repository to show your support.
Contributing
- Fork the repository.
- Find an issue to work on and submit a pull request.
- Could not find an issue? Look for documentation, bugs, typos, and missing features.
License
- Apache License Version 2.0, see LICENSE.
Grafana Cloud Free
- Free tier: Limited to 3 users
- Paid plans: $55 / user / month above included usage
- Access to all Enterprise Plugins
- Fully managed service (not available to self-manage)
Self-hosted Grafana Enterprise
- Access to all Enterprise plugins
- All Grafana Enterprise features
- Self-manage on your own infrastructure
Installing Redis on Grafana Cloud:
Installing plugins on a Grafana Cloud instance is a one-click install; same with updates. Cool, right?
Note that it could take up to 1 minute to see the plugin show up in your Grafana.
Installing plugins on a Grafana Cloud instance is a one-click install; same with updates. Cool, right?
Note that it could take up to 1 minute to see the plugin show up in your Grafana.
Installing plugins on a Grafana Cloud instance is a one-click install; same with updates. Cool, right?
Note that it could take up to 1 minute to see the plugin show up in your Grafana.
Installing plugins on a Grafana Cloud instance is a one-click install; same with updates. Cool, right?
Note that it could take up to 1 minute to see the plugin show up in your Grafana.
Installing plugins on a Grafana Cloud instance is a one-click install; same with updates. Cool, right?
Note that it could take up to 1 minute to see the plugin show up in your Grafana.
Installing plugins on a Grafana Cloud instance is a one-click install; same with updates. Cool, right?
Note that it could take up to 1 minute to see the plugin show up in your Grafana.
Installing plugins on a Grafana Cloud instance is a one-click install; same with updates. Cool, right?
Note that it could take up to 1 minute to see the plugin show up in your Grafana.
For more information, visit the docs on plugin installation.
Installing on a local Grafana:
For local instances, plugins are installed and updated via a simple CLI command. Plugins are not updated automatically, however you will be notified when updates are available right within your Grafana.
1. Install the Data Source
Use the grafana-cli tool to install Redis from the commandline:
grafana-cli plugins install The plugin will be installed into your grafana plugins directory; the default is /var/lib/grafana/plugins. More information on the cli tool.
Alternatively, you can manually download the .zip file for your architecture below and unpack it into your grafana plugins directory.
Alternatively, you can manually download the .zip file and unpack it into your grafana plugins directory.
2. Configure the Data Source
Accessed from the Grafana main menu, newly installed data sources can be added immediately within the Data Sources section.
Next, click the Add data source button in the upper right. The data source will be available for selection in the Type select box.
To see a list of installed data sources, click the Plugins item in the main menu. Both core data sources and installed data sources will appear.
Change Log
2.2.0 (2023-07-12)
Features / Enhancements
- Added FT.SEARCH command to datasource (#297)
- Added GROUPBY argument to TS.MRANGE command (#304)
- Upgraded Grafana Go SDK version (#302)
- Adding new aggregators for TS.MRANGE/TS.RANGE (#260)
Bug fixes
- Fixed issue with non-string scalars in JSON.GET (#301)
- Various security patches (#258, #267, #281, #307)
2.1.2 (2023-06-12)
Bug fixes
- Fix issue connecting to Redis 7 cluster instances (#284)
2.1.1 (2022-01-18)
Features / Enhancements
- Upgrade to Grafana 8.3.4
2.1.0 (2022-01-17)
Features / Enhancements
- Upgrade to Grafana 8.2.5 (#237)
- Upgrade to Grafana 8.3.0 (#244)
- Update Components naming (#247)
- Add RedisGears PYEXECUTE function to Query Editor (#248)
- Add Grafana Marketplace to README (#249)
- Update follows-redirect package (#253)
Bug fixes
- Grafana template variables not working for the Default datasource (#242)
- Fix JSON.GET: interface conversion: interface {} is string (#246)
2.0.0 (2021-11-10)
Breaking changes
- Supports Grafana 8.0+, for Grafana 7.X use version 1.5.0
- XRANGE command based on the selected time range if Start/End is not specified. Use '-' as Start and '+' as end to display all results.
Features / Enhancements
- Upgrade to Grafana 8.0.6 (#212)
- Allow multiple Streaming queries per panel (#213)
- Update Grafana SDK 0.110 (#214)
- Update to Grafana 8.1.4 (#217)
- Update to Grafana 8.2.1 (#220)
- Update to Grafana 8.2.2 (#223)
- Use Time-range for XRANGE filtering (#176)
- Disable Command-line interface in the Query Editor (#226)
- Support of ZRANGE command (#182)
- Upgrade Grafana 8.2.3 and backend dependencies (#228)
- Support fetching from RedisJSON datasource (JSON.GET, JSON.TYPE, JSON.ARRLEN, JSON.OBJLEN, JSON.OBJKEYS) (#229)
- Redis Enterprise introduced new field calls_master in commandstats (#232)
Bug fixes
- Fix RedisGears rg.dumpreqs command when Requirement was not yet downloaded so wheels are not available (#219)
- SCARD does not show a key field any more (#233)
1.5.0 (2021-07-06)
Breaking changes
- HGET returns field with values named as requested field instead of "Value" similar to HMGET and HGETALL.
- Streaming field
timemoved from Frontend to Backend. Field's name renamed to "#time" to avoid confusion with returned fields.
Features / Enhancements
- Add Redis Explorer to README and minor docker updates (#195)
- Alerting for Grafana-Redis-Datasource #166
- Add support for Sentinel ACL User and Password authentication separate from Redis #197
- Add Support for RedisGraph query nodes count (#199)
- Add GRAPH.EXPLAIN and GRAPH.PROFILE commands (#200)
- Add GRAPH.CONFIG and RedisGraph refactoring (#201)
- Refactor RedisTimeSeries and RedisGears commands (#202)
- Upgrade Grafana 7.5.7 and backend dependencies (#203)
- Add Streaming dashboard for v8 and update #time streaming field (#204)
- Add TS.MGET command (#209)
- Refactor Redis commands (#210)
Bug fixes
- Fix NaN for variables (#206)
1.4.0 (2021-05-08)
Features / Enhancements
- Update Grafana SDK 0.88 and other backend dependencies (#170)
- Add $time field for Streams XRANGE (#175)
- Add RG.PYDUMPREQS command and integration test fix (#183)
- Add Integration tests to CI (#184)
- Upgrade Grafana dependencies to 7.5.4 (#185)
- Update Dashboard to 7.5.4 and add data source variable (#186)
- Update backend dependencies and linting issues (#187)
- Update Documentation (#188)
Bug fixes
- Tls client certificates not working (#177)
1.3.1 (2021-02-04)
Features / Enhancements
- Add Unit test for Golang Backend #119
- Remove "Unknown command" error from response for custom panels #125
- Update Radix to 3.7.0 and other backend dependencies #128
- Redis client, unit-tests refactoring and new unit-tests. #129
- Implement CLI-mode similar to Redis-cli #135
- Added support for errorstats features coming in redis 6.2; Extended commandstats fields with failedCalls and rejectedCalls #137
- Add command to support the panel to show the biggest keys (TMSCAN) #133
- Add RedisGears commands (RG.PYSTATS, RG.DUMPREGISTRATIONS, RG.PYEXECUTE) #136
- Implement XRANGE and XREVRANGE commands #148
- Add Client Type tooltip #149
- Refactoring Query Editor #151
- Add handling different frame type for Streaming data source #152
- Update tooltip for RedisTimeSeries Label Filter #155
- Update Loading state for Streaming for Grafana 7.4 #158
- Update Grafana SDK 0.86 to fix race conditions #160
- Add Redis Graph module (GRAPH.QUERY, GRAPH.SLOWLOG) #157
Bug fixes
- Experiencing memory leak in Grafana docker seemingly stemming from this plugin #116
- All Redis Datasource timeout when one is not reachable #73
1.3.0 (2021-01-05)
Breaking changes
- HGETALL returns hash fields in a row similar to HGET, HMGET to support streaming. Previously each hash field returned as row.
- Time Bucket for RedisTimeSeries TS.RANGE and TS.MRANGE was updated from string to integer. To fix the dashboard JSON:
- Search for
"bucket"="X" - Remove quotes
- Search for
- RedisTimeSeries TS.RANGE command was updated to have legend and value override similar to TS.MRANGE. Previous
legenddefined field's name. keyparameter for command like GET, HGET, SMEMBERS was updated tokeyNameto avoid conflicts. To fix the dashboard JSON:- Search for
"key"="X" - Replace to
"keyName"="X"
- Search for
Features / Enhancements
- Update description and GitHub issues #83
- Add RediSearch FT.INFO command #97
- Add HMGET Command #98
- Update release workflow #99
- Update Grafana dependencies to 7.3.5 #100
- Update Grafana SDK 0.80.0 #101
- Update data source icon and refactoring #102
- Update field's name for HGET command to align with HMGET #103
- Update HGETALL command to return fields and support streaming similar to HGET, HMGET #104
- Add tests for React Config and Query editors #105
- Remove CircleCI and move to Github Actions #106
- Update Bucket's type (string->number) and add type values for Aggregation and Info sections #108
- Add tests for React Data Source #113
- Update Bucket to Time Bucket in Query Editor #114
- Check if string value is a number when streaming #115
- Add Tests Coverage #117
- Add Empty Array when no values returned similar to redis-cli #120, #121
- Add test data for backend testing #122
Bug fixes
- Fix "NOAUTH Authentication required" error with sentinel #109
- Add Value Label to TS.RANGE command similar to TS.MRANGE #110
- Update default configuration parameters for Data Source #111
- Update Key to KeyName to avoid conflict in the Explore tab #112
1.2.1 (2020-10-24)
Features / Enhancements
- Support Connecting to Redis via Unix Socket #58
- Support Redis 6 ACL authentication #60
- Update Grafana dependencies to 7.2.0 #66
- Update and optimize dashboards for Grafana 7.2.0 #67
- Add Streaming for Command Statistics #68
- Add Size parameter for SLOWLOG GET #79
- Update GitHub org to RedisGrafana #80
Bug fixes
- Plugin health check failed for ARM on Linux #61
- Timeseries data time stamp truncated to seconds #64
1.2.0 (2020-08-26)
Features / Enhancements
- Added docker cmd line option to start in README #31
- How to query a specific database inside the same Redis single node #34
- Update docker-compose to load datasource from the repository and add development file #39
- Use "ScopedVars" when applying template variables #37 (fix for #36)
- Refactoring to support new commands and modules #42
- Add support for TS.GET, TS.INFO, and TS.QUERYINDEX commands #45
- Add Redis dashboard to support multiple Redis instances #49
- Plugin executable missing for arm64 architecture #48 (Grafana SDK: https://github.com/grafana/grafana-plugin-sdk-go/pull/221)
- Return 0 for all buckets with 0 counts on time-series
TS.RANGEqueries #50 - Add Redis Cluster support and update monitoring dashboard #52
- Connection issue to Redis deployed in k8s (Sentinel) #38
- MRANGE: add fill zero option #53
- Add Streaming capabilities to visualize INFO command #57
Bug fixes
- Slowlog returns 'No data' for Redis 3.0.6 #33
- Fix backend lint issues #41
- ts.mrange returns no data when label has spaces within #44
1.1.2 (2020-07-29)
Features / Enhancements
- Remove developer jargon from README #30
- Redis Datasource is Unsigned. K8S+Helm installation #29
1.1.1 (2020-07-28)
Features / Enhancements
- Screenshots added to plugin.json and updated in the README
- CHANGELOG added to display on the Plugin page
1.1.0 (2020-07-24)
Features / Enhancements
- Updated to Grafana 7.1.0 and the latest version of Radix #27
- Add dashboard as a part of datasource #25
- Add Field config units to the response #26
1.0.0 (2020-07-13)
Features / Enhancements
- Initial release based on Grafana 7.0.5.
- Allows configuring password, TLS, and advanced settings.
- Supports Redis commands: CLIENT LIST, GET, HGET, HGETALL, HKEYS, HLEN, INFO, LLEN, SCARD, SLOWLOG GET, SMEMBERS, TTL, TYPE, XLEN.
- Supports RedisTimeSeries commands: TS.MRANGE, TS.RANGE.
- Provides Redis monitoring dashboard.


