Visualization and monitoring solutions
mongodb logo

MongoDB visualization

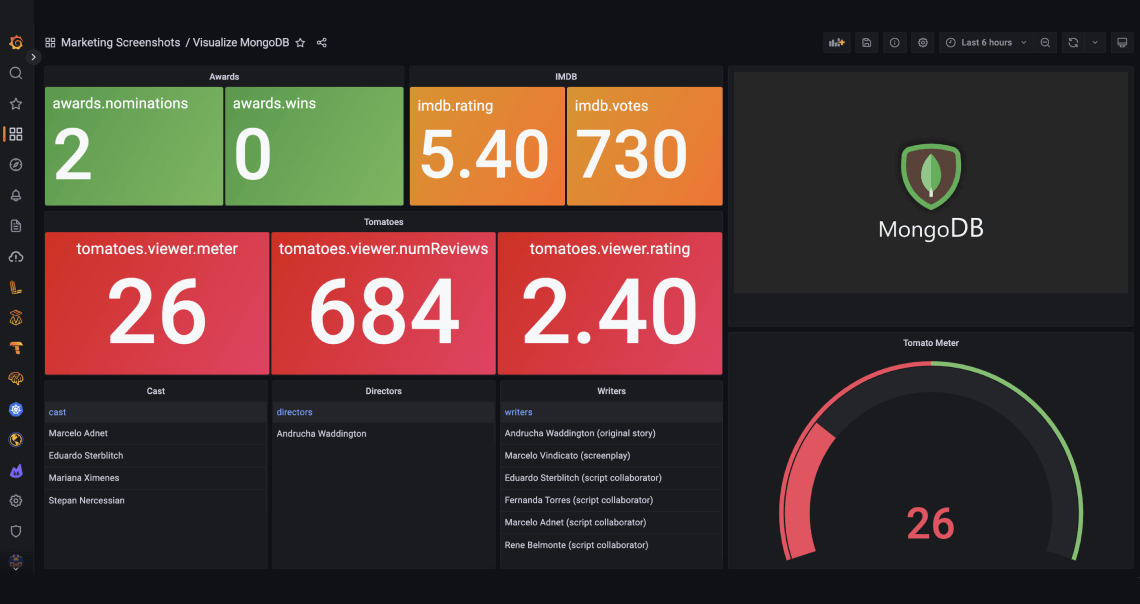
grafana mongodb monitoring dashboard

The MongoDB data source plugin is the simplest way to visualize MongoDB data in a dashboard. You can interact in real time with your existing MongoDB data and unify data sets across your company into a single diagnostic workspace.

Single pane of glass for all your data

Connect your MongoDB data and other data sources to a single dashboard to provide impactful insights into your business and improve visibility across teams. For example, get a real-time look into the business impact of an application slowdown by combining business transaction volume alongside system health metrics.
Grafana Frontend Observability overview dashboard.

mongodb + sap + prometheus dashboard

Visualize MongoDB and MongoDB Atlas data without moving or duplicating it

Translate and transform your existing application and business metrics into flexible and versatile charts within dashboards using a wide array of visualizations, such as panels, bar gauges, geomaps, and more. Also query and alert on MongoDB and MongoDB Atlas data in real time without having to migrate or ingest it.

Correlate all your MongoDB data with a wide range of data sources

Get instant access to 80+ data sources, including Elasticsearch, Jira, Datadog, Splunk, AppDynamics, Oracle, Snowflake, ServiceNow, and more. Then you can, for example, identify root causes more quickly by combining your data, logs from Splunk, infrastructure health metrics from Datadog, and software development insights from Jira into a single view.
Correlate MongoDB with data sources

“I think Grafana is the gel that pulls everything together from across the business to give us a real-time snapshot of how Utilita’s doing at any given moment. It’s incredibly valuable.”
Adrian Goater
Web Development Manager

How to configure MongoDB with Grafana Cloud

It only takes a few clicks to add your MongoDB connection string and authentication credentials. Then you can write MongoDB queries and create a Grafana dashboard with your MongoDB data and MongoDB Atlas data.

For full implementation details and best practices, see the step-by-step MongoDB data source guide.

Get started with these easy steps

2

With a few clicks, set up default configurations for prebuilt dashboards and alerting rules.

3

Data will stream from your cluster into Grafana Cloud.

Need to self-manage?

Contact us