Application Observability with OpenTelemetry Collector
Grafana Application Observability is compatible with the OpenTelemetry Collector, however the feature is experimental, and we are exploring ways to support Collector deployments.
We have users successfully using the upstream Collector with Grafana Application Observability, and we can provide the correct config to support the required features where possible.
Prerequisites
To set up OpenTelemetry Collector as the data collector to send to Grafana Cloud:
- Create and/or login to a Grafana Cloud account
- Install an OpenTelemetry Collector
There are two distributions of the OpenTelemetry Collector: core and contrib. Application Observability requires the contrib distribution.
Configuration
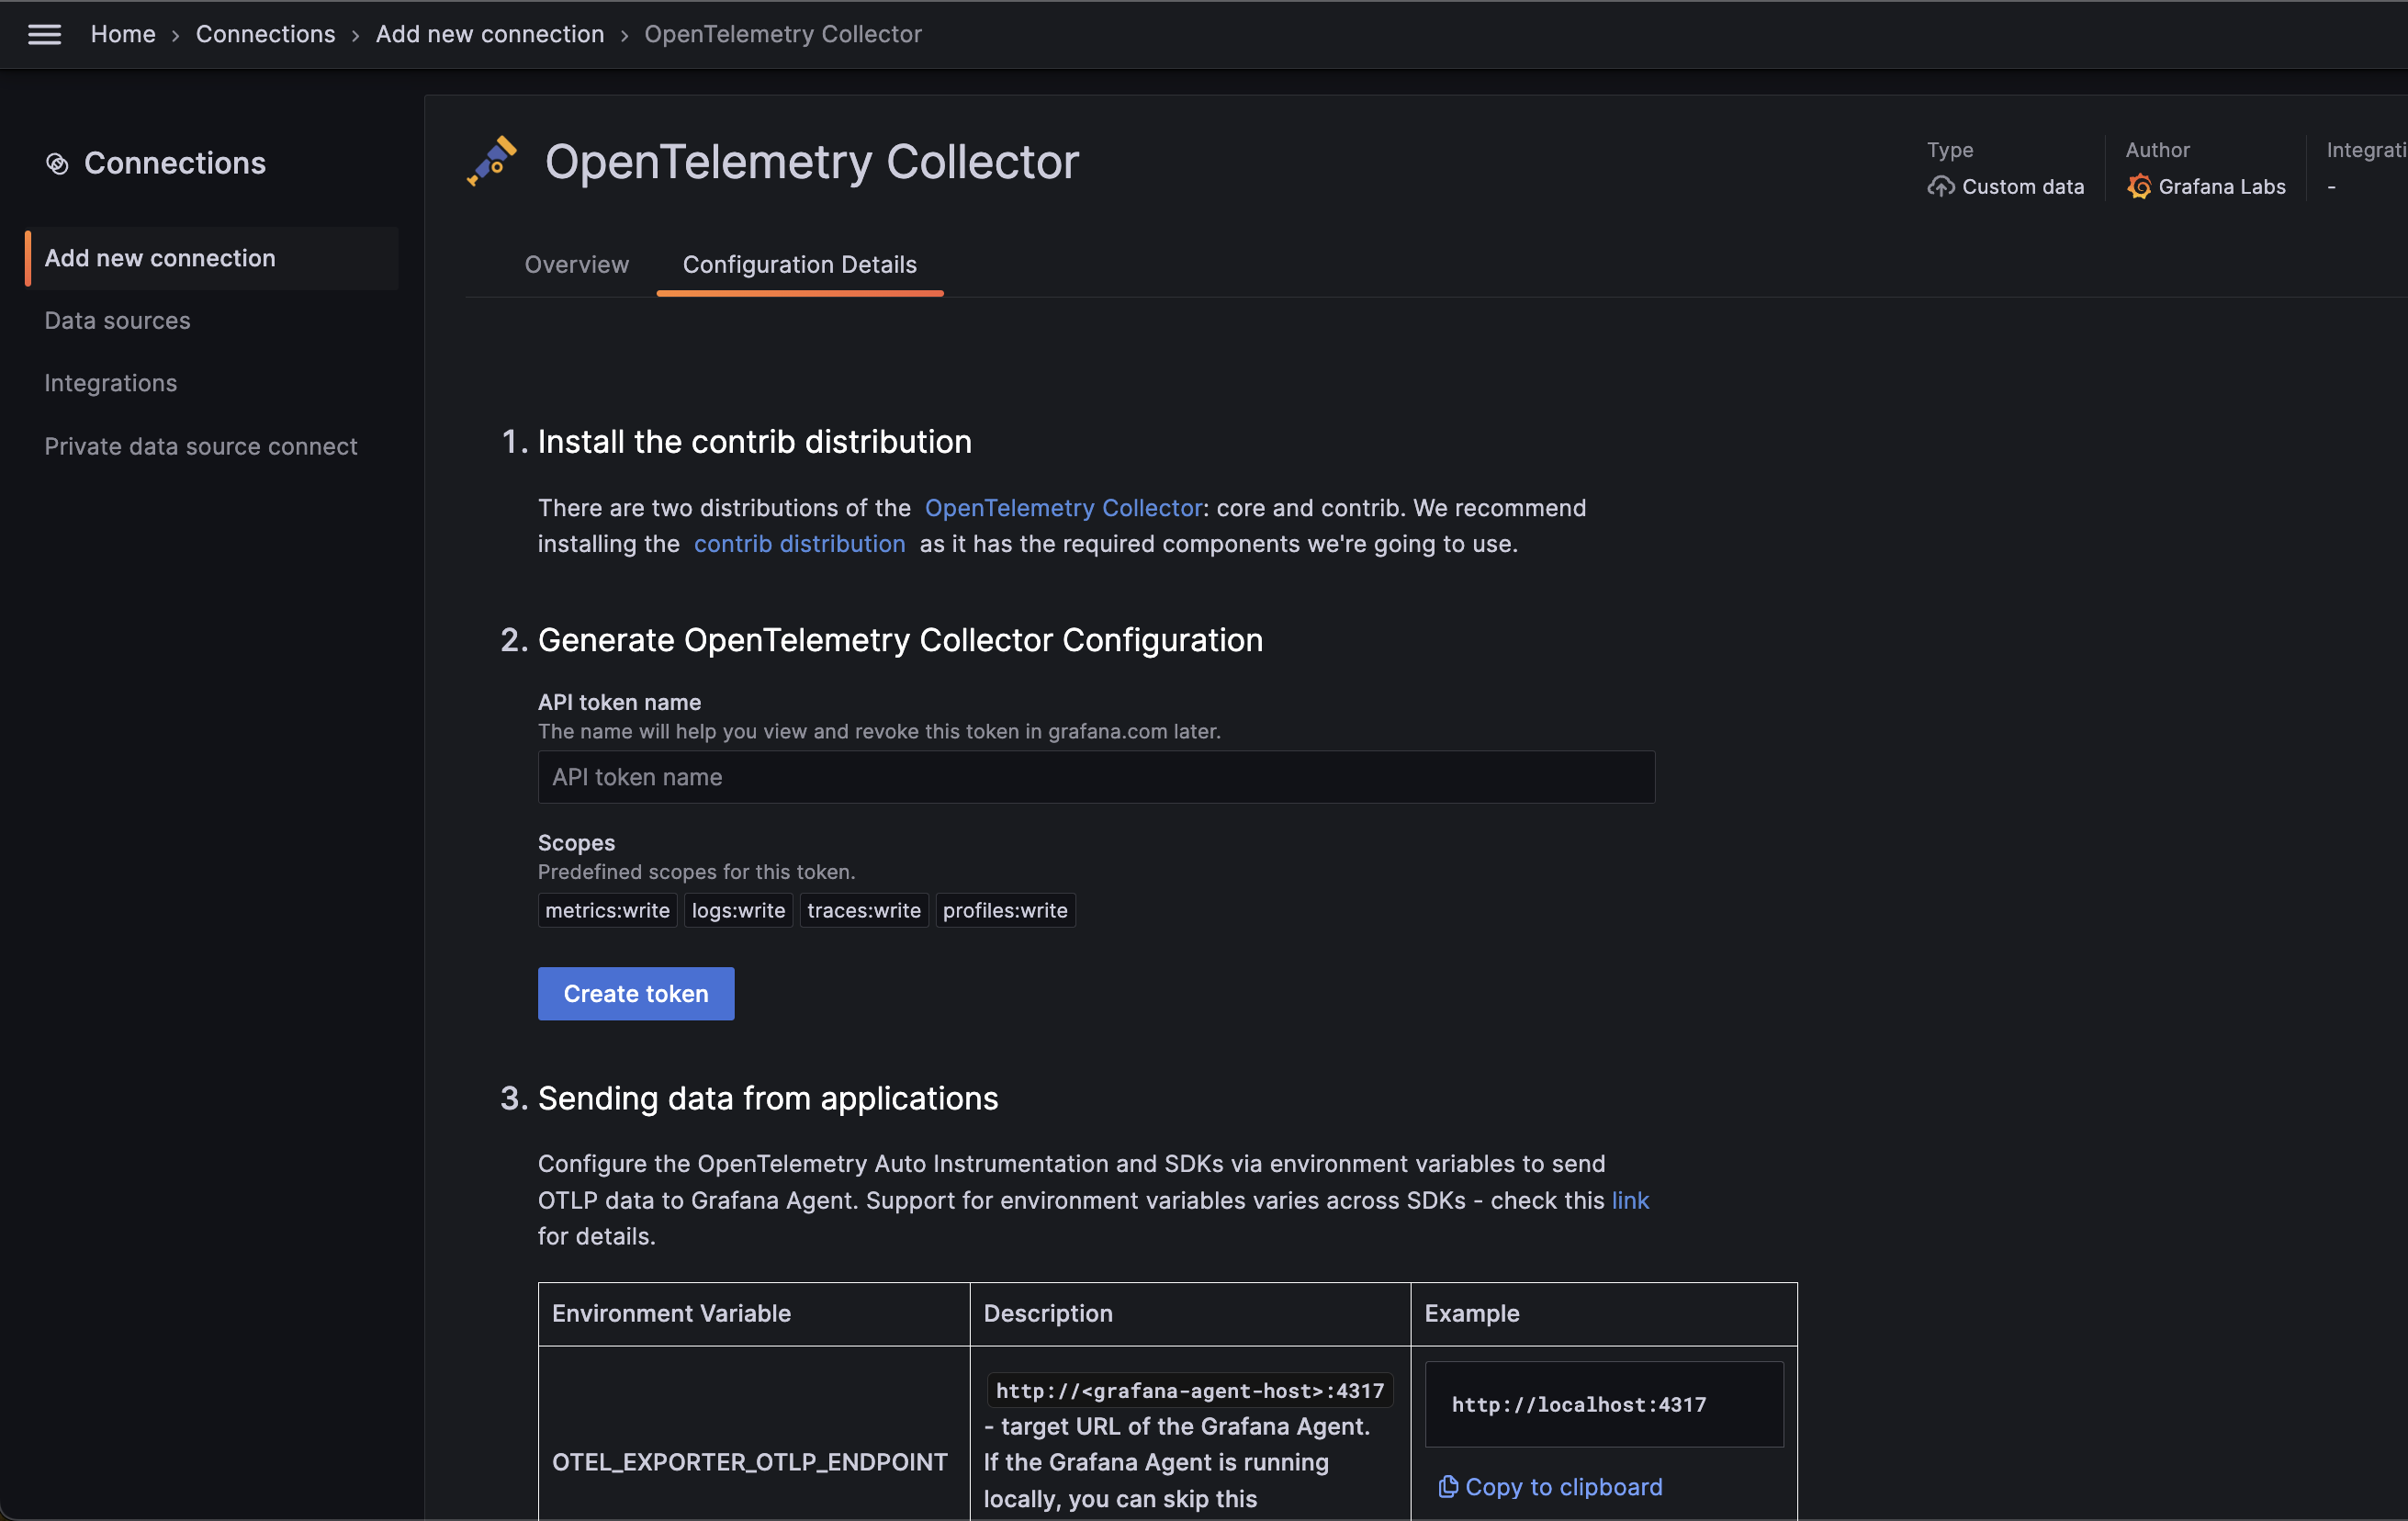
A config.yaml configuration file is needed for the OpenTelemetry Collector to run. It is recommended to use the OpenTelemetry Collector integration to generate a configuration file.
To find this integration follow the OpenTelemetry -> Application page and press the “Add service” button. Choose the OpenTelemetry Collector integration from the list.

The OpenTelemetry Collector integration will generate OpenTelemetry Collector configuration to use with Grafana Application Observability:
# Tested with OpenTelemetry Collector Contrib v0.98.0
receivers:
  otlp:
    # https://github.com/open-telemetry/opentelemetry-collector/tree/main/receiver/otlpreceiver
    protocols:
      grpc:
      http:
  hostmetrics:
    # Optional. Host Metrics Receiver added as an example of Infra Monitoring capabilities of the OpenTelemetry Collector
    # https://github.com/open-telemetry/opentelemetry-collector-contrib/tree/main/receiver/hostmetricsreceiver
    scrapers:
      load:
      memory:

processors:
  batch:
    # https://github.com/open-telemetry/opentelemetry-collector/tree/main/processor/batchprocessor
  resourcedetection:
    # Enriches telemetry data with resource information from the host
    # https://github.com/open-telemetry/opentelemetry-collector-contrib/tree/main/processor/resourcedetectionprocessor
    detectors: ["env", "system"]
    override: false
  transform/drop_unneeded_resource_attributes:
    # https://github.com/open-telemetry/opentelemetry-collector-contrib/tree/main/processor/transformprocessor
    error_mode: ignore
    trace_statements:
      - context: resource
        statements:
          - delete_key(attributes, "k8s.pod.start_time")
          - delete_key(attributes, "os.description")
          - delete_key(attributes, "os.type")
          - delete_key(attributes, "process.command_args")
          - delete_key(attributes, "process.executable.path")
          - delete_key(attributes, "process.pid")
          - delete_key(attributes, "process.runtime.description")
          - delete_key(attributes, "process.runtime.name")
          - delete_key(attributes, "process.runtime.version")
    metric_statements:
      - context: resource
        statements:
          - delete_key(attributes, "k8s.pod.start_time")
          - delete_key(attributes, "os.description")
          - delete_key(attributes, "os.type")
          - delete_key(attributes, "process.command_args")
          - delete_key(attributes, "process.executable.path")
          - delete_key(attributes, "process.pid")
          - delete_key(attributes, "process.runtime.description")
          - delete_key(attributes, "process.runtime.name")
          - delete_key(attributes, "process.runtime.version")
    log_statements:
      - context: resource
        statements:
          - delete_key(attributes, "k8s.pod.start_time")
          - delete_key(attributes, "os.description")
          - delete_key(attributes, "os.type")
          - delete_key(attributes, "process.command_args")
          - delete_key(attributes, "process.executable.path")
          - delete_key(attributes, "process.pid")
          - delete_key(attributes, "process.runtime.description")
          - delete_key(attributes, "process.runtime.name")
          - delete_key(attributes, "process.runtime.version")
  transform/add_resource_attributes_as_metric_attributes:
    # https://github.com/open-telemetry/opentelemetry-collector-contrib/tree/main/processor/transformprocessor
    error_mode: ignore
    metric_statements:
      - context: datapoint
        statements:
          - set(attributes["deployment.environment"], resource.attributes["deployment.environment"])
          - set(attributes["service.version"], resource.attributes["service.version"])

exporters:
  otlp/grafana_cloud_traces:
    # https://github.com/open-telemetry/opentelemetry-collector/tree/main/exporter/otlpexporter
    endpoint: "${env:GRAFANA_CLOUD_TEMPO_ENDPOINT}"
    auth:
      authenticator: basicauth/grafana_cloud_traces

  loki/grafana_cloud_logs:
    # https://github.com/open-telemetry/opentelemetry-collector-contrib/tree/main/exporter/lokiexporter
    endpoint: "${env:GRAFANA_CLOUD_LOKI_URL}"
    auth:
      authenticator: basicauth/grafana_cloud_logs

  prometheusremotewrite/grafana_cloud_metrics:
    # https://github.com/open-telemetry/opentelemetry-collector-contrib/tree/main/exporter/prometheusremotewriteexporter
    endpoint: "${env:GRAFANA_CLOUD_PROMETHEUS_URL}"
    auth:
      authenticator: basicauth/grafana_cloud_metrics
    add_metric_suffixes: false

extensions:
  basicauth/grafana_cloud_traces:
    # https://github.com/open-telemetry/opentelemetry-collector-contrib/tree/main/extension/basicauthextension
    client_auth:
      username: "${env:GRAFANA_CLOUD_TEMPO_USERNAME}"
      password: "${env:GRAFANA_CLOUD_API_KEY}"
  basicauth/grafana_cloud_metrics:
    client_auth:
      username: "${env:GRAFANA_CLOUD_PROMETHEUS_USERNAME}"
      password: "${env:GRAFANA_CLOUD_API_KEY}"
  basicauth/grafana_cloud_logs:
    client_auth:
      username: "${env:GRAFANA_CLOUD_LOKI_USERNAME}"
      password: "${env:GRAFANA_CLOUD_API_KEY}"

connectors:
  grafanacloud:
    # https://github.com/open-telemetry/opentelemetry-collector-contrib/tree/main/connector/grafanacloudconnector
    host_identifiers: ["host.name"]

service:
  extensions:
    [
      basicauth/grafana_cloud_traces,
      basicauth/grafana_cloud_metrics,
      basicauth/grafana_cloud_logs,
    ]
  pipelines:
    traces:
      receivers: [otlp]
      processors:
        [resourcedetection, transform/drop_unneeded_resource_attributes, batch]
      exporters: [otlp/grafana_cloud_traces, grafanacloud]
    metrics:
      receivers: [otlp, hostmetrics]
      processors:
        [
          resourcedetection,
          transform/drop_unneeded_resource_attributes,
          transform/add_resource_attributes_as_metric_attributes,
          batch,
        ]
      exporters: [prometheusremotewrite/grafana_cloud_metrics]
    metrics/grafanacloud:
      receivers: [grafanacloud]
      processors: [batch]
      exporters: [prometheusremotewrite/grafana_cloud_metrics]
    logs:
      receivers: [otlp]
      processors:
        [resourcedetection, transform/drop_unneeded_resource_attributes, batch]
      exporters: [loki/grafana_cloud_logs]
The instrumented application sends traces, metrics and logs to the collector via OTLP. The collector receives data and processes it with defined pipelines.
The traces pipeline receives traces with the otlp receiver and exports them to the Grafana Cloud Tempo with the otlp exporter.
The resourcedetection processor here and in the further pipelines is used to enrich telemetry data with resource information from the host.
Consult the resource detection processor README.md for a list of configuration options.
The metrics pipeline receives traces from the otlp receiver, and applies a transform processor to add deployment.environment, and service.version labels to metrics,
and exports metrics to the Grafana Cloud Metrics with the prometheusremotewrite exporter.
The hostmetrics receiver is optional. It is added here as an example of Infra Monitoring capabilities of the OpenTelemetry Collector.
The logs pipeline receives logs with the otlp receiver and exports them to the Grafana Cloud Loki with the loki exporter.
The configuration file requires several environmental variable to be set. They are described in the following table.
| Environment Variable | Description | Example |
|---|---|---|
GRAFANA_CLOUD_API_KEY | API key generated above | eyJvSomeLongStringJ9fQ== |
GRAFANA_CLOUD_PROMETHEUS_URL | Remote Write Endpoint from Grafana Cloud > Prometheus > Details | https://prometheus-prod-***.grafana.net/api/prom/push |
GRAFANA_CLOUD_PROMETHEUS_USERNAME | Username / Instance ID from Grafana Cloud > Prometheus > Details | 11111 |
GRAFANA_CLOUD_LOKI_URL | url (without the username and password part) from Grafana Cloud > Loki > Details > From a standalone host | https://logs-prod-***.grafana.net/loki/api/v1/push |
GRAFANA_CLOUD_LOKI_USERNAME | User from Grafana Cloud > Loki > Details | 11112 |
GRAFANA_CLOUD_TEMPO_ENDPOINT | endpoint from Grafana Cloud > Tempo > Details > Sending Data to Tempo | tempo-***.grafana.net:443 |
GRAFANA_CLOUD_TEMPO_USERNAME | User from Grafana Cloud > Tempo > Details | 11113 |
Running the OpenTelemetry Collector
Create the config.yaml file, set the necessary environment variables, and start the OpenTelemetry Collector.
Language Specific Guides
Language specific guides that show how to instrument your application can be found in the production instrumentation guides.
Was this page helpful?
Related resources from Grafana Labs


