Menu
Documentation Grafana Cloud
 Monitor applications
 Application Observability
 Instrumentation setup
 Quickstart
Grafana Cloud
Application Observability quickstart
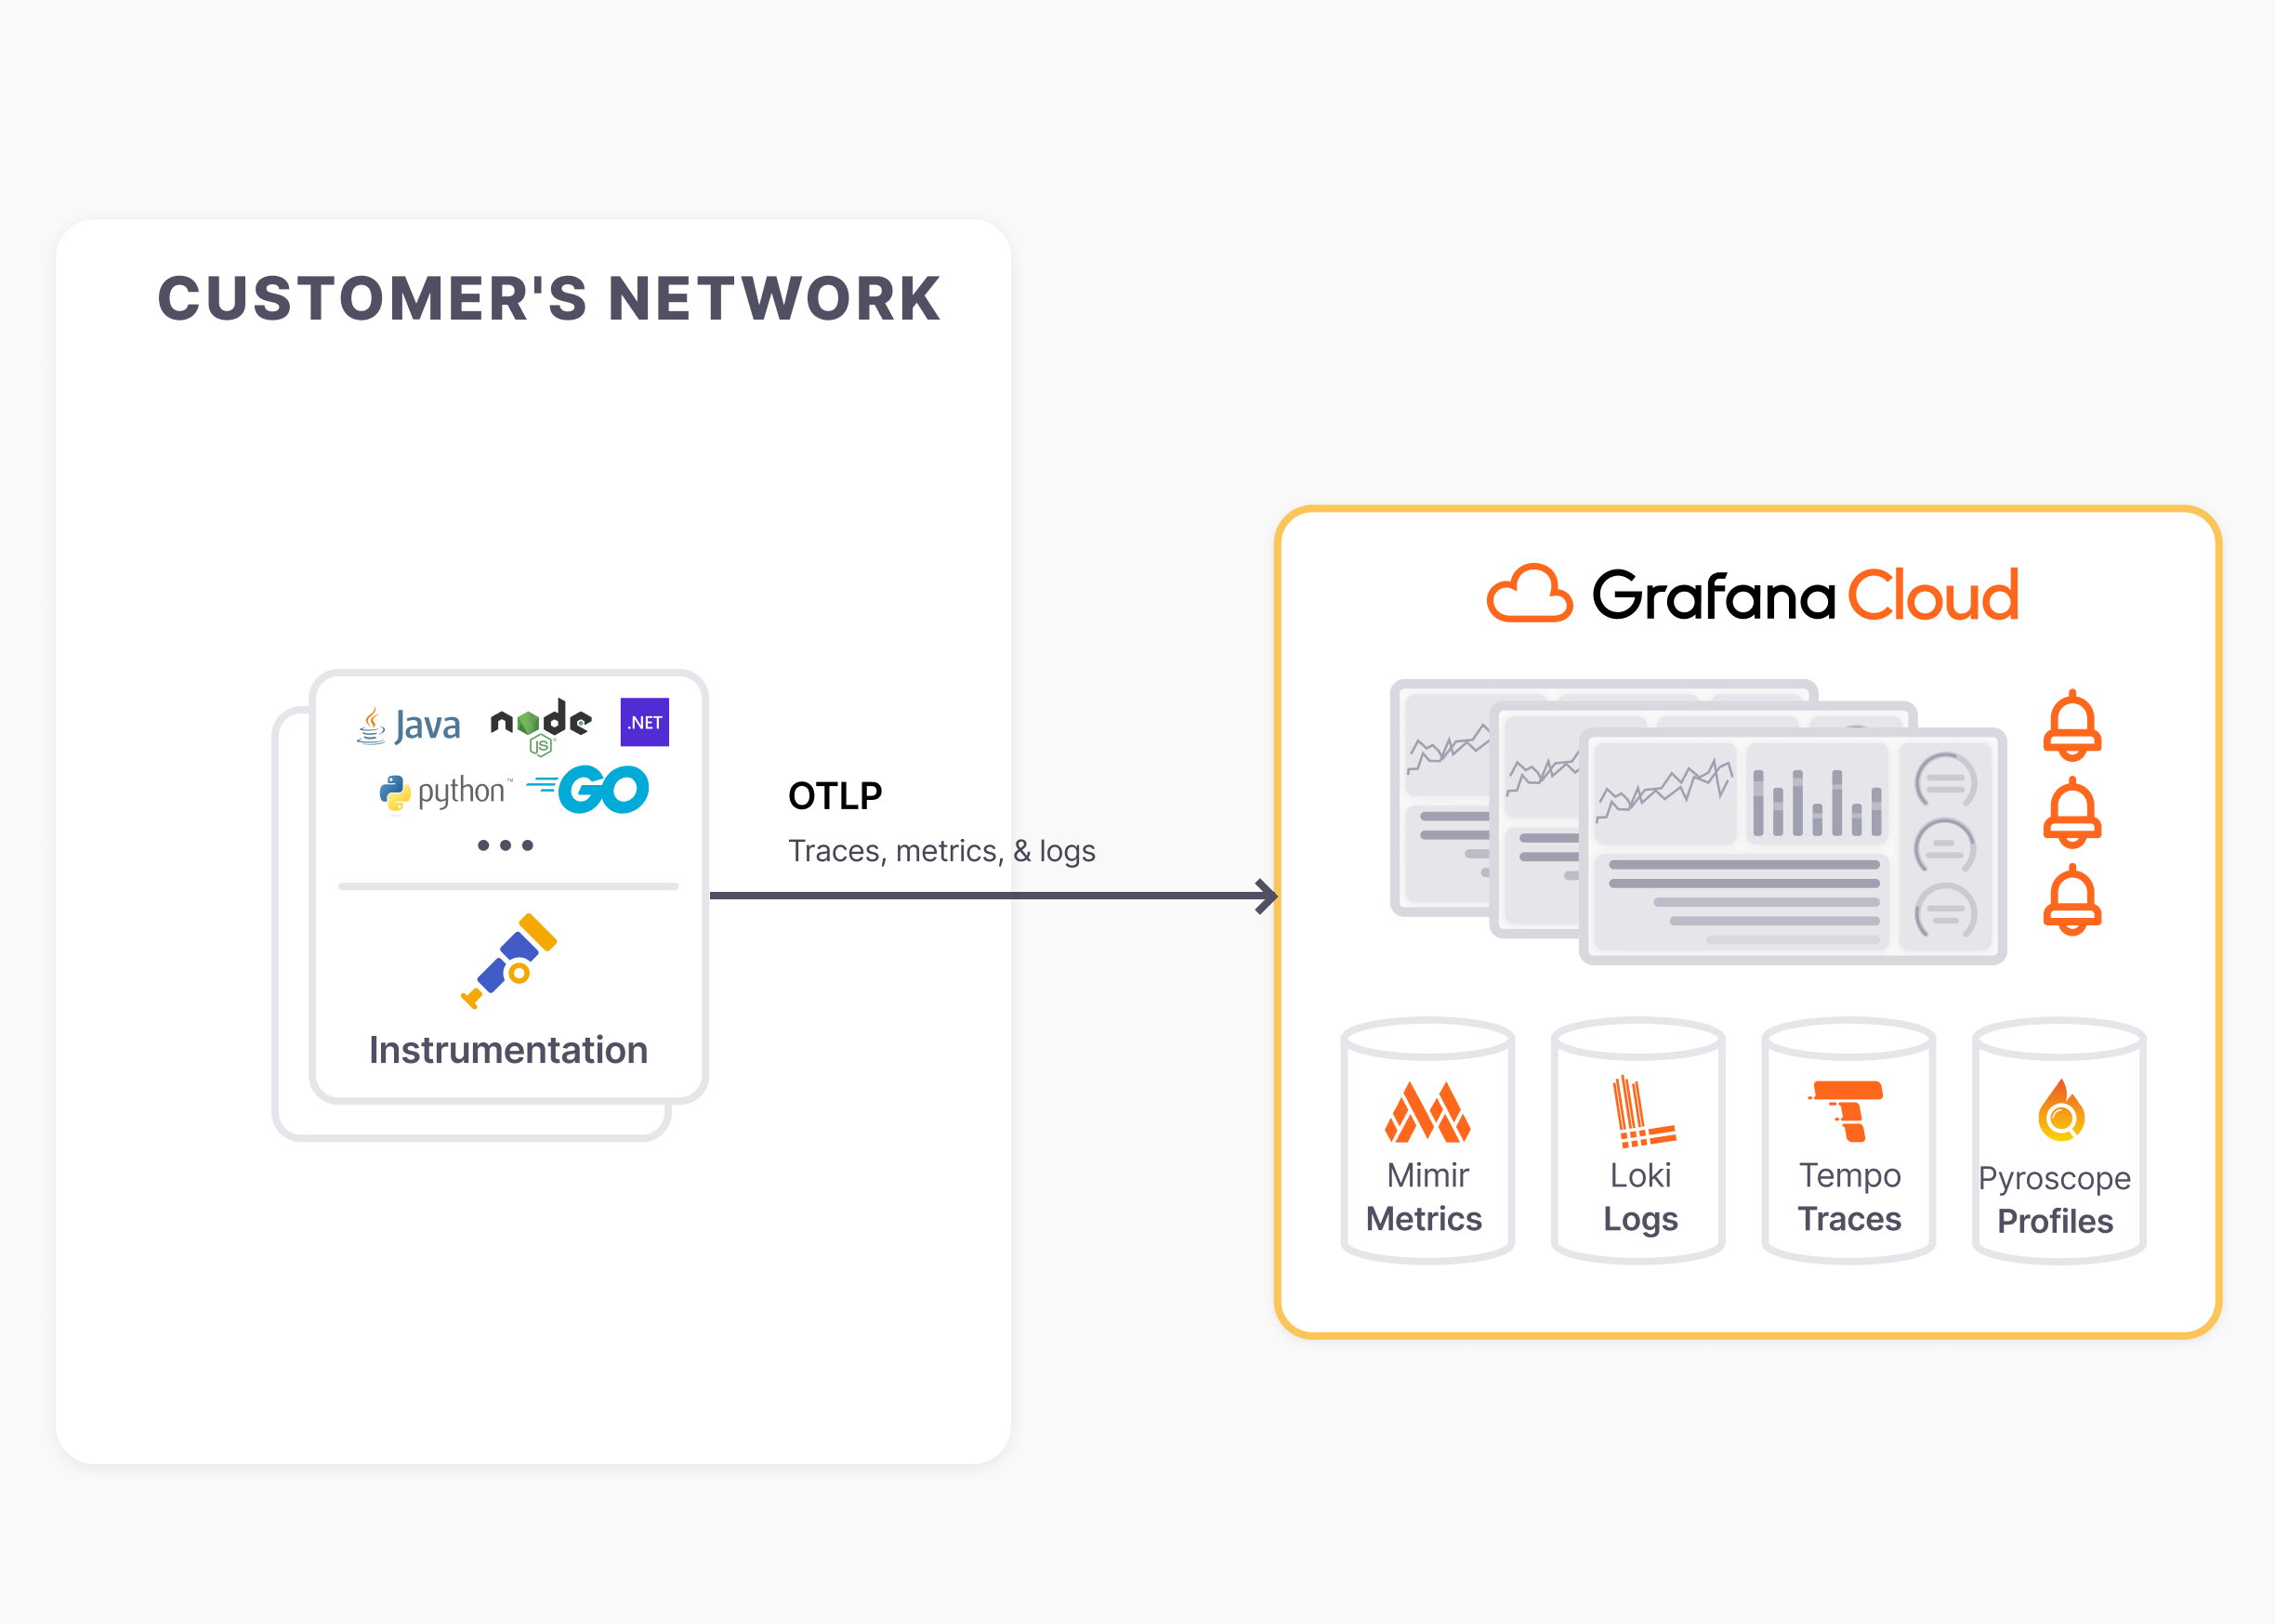
The easiest and quickest way to get started with Application Observability is a local development setup that instruments a service with a Grafana OpenTelemetry distribution and sends the telemetry data directly to the Grafana Cloud OTLP gateway.

Opt-in for metrics generation
Application Observability requires Grafana Cloud metrics generation. Opt-in for Grafana Cloud metrics generation if it is not already enabled. Note, there is a cost associated with enabling this feature.
Quickstart guides
These quickstart guides are intended for local development or evaluation setups and send data directly to Grafana Cloud without a data collector.
Note
For a production setup with a data collector and troubleshooting information, consult the production documentation.
For other languages, use the upstream OpenTelemetry SDKs supported by the community.
Why should you use Beyla?
- Easy: No need to modify or redeploy your application.
- Legacy support: The language or language version is not supported by current OpenTelemetry SDKs.
- Third-party application: You want to instrument third-party applications (Apache, Nginx…)
- Performance: Your instrumentation libraries have too much impact in the performance of your applications (e.g. some Python high-load services)
Note
Beyla does not have the same capabilities as the OpenTelemetry SDKs. For example, Beyla only supports trace context propagation in Go (and in some limited cases for non-Go programs); so in most cases it only creates a single span for each non-Go service.
Was this page helpful?
Related resources from Grafana Labs
Additional helpful documentation, links, and articles:

Getting started with the Grafana LGTM Stack
In this webinar, we’ll demo how to get started using the LGTM Stack: Loki for logs, Grafana for visualization, Tempo for traces, and Mimir for metrics.

Intro to Kubernetes monitoring in Grafana Cloud
In this webinar you’ll learn how Grafana offers developers and SREs a simple and quick-to-value solution for monitoring their Kubernetes infrastructure.

Building advanced Grafana dashboards
In this webinar, we’ll demo how to build and format Grafana dashboards.
