Collect logs with Grafana Agent
The Grafana Cloud stack includes a logging service powered by Grafana Loki, a Prometheus-inspired log aggregation system. This means that you’re not required to run your own Loki environment, though you can ship logs to Grafana Cloud using Promtail or another supported client if you wish to maintain a self-hosted Loki environment. See Collect logs with Promtail.
Before you begin
To follow the steps in this guide, you need the following:
- A Grafana Cloud account
- An application or system generating logs
Install Grafana Agent
Grafana Agent supports collecting logs and sending them to Loki using its loki subsystem. This is done using the upstream Promtail client, which is the official first-party log collection client created by the Loki developer team. Grafana Agent is usually deployed to every machine that has log data to be monitored. For options to horizontally scale your deployment of Grafana Agents, see this operation guide.
With the goal of collecting logs, the Grafana Agent can be installed the following ways:
- Install the agent bundled with a Grafana Cloud integration that supports collecting logs.
Review the Grafana Agent configuration file
The Grafana Agent configuration file contents and location will depend on the installation options discussed previously. For standalone installs on a single host in a Linux environment, the agent configuration is stored in /etc/grafana-agent.yaml by default.
Note
Read Loki label best practices to learn how to use labels effectively for the best experience.
Some integrations configure the Grafana Agent YAML configuration file to ship logs by default. Follow the instructions provided in the integrations install process as needed.
If you would like to add additional sections for logs in other locations or with other filenames, see these examples below.
In this example, a job is added to send anything ending in log from the location /var/log/. The job is added just below the scrape_configs: section and before any other job_name sections:
scrape_configs:
  - job_name: varlogs
    static_configs:
      - targets: [localhost]
        labels:
          job: varlogs
          __path__: /var/log/*log
  - job_name: applogs
Here is an example for dmesg logs:
- job_name: dmesg
  static_configs:
    - targets: [localhost]
      labels:
        job: dmesg
        __path__: /var/log/dmesg
Here is another example, scraping logs for a Minecraft server with logs stored in a subdirectory of the /home directory of a special minecraft user.
- job_name: minecraftlog
  static_configs:
    - targets: [localhost]
      labels:
        job: minecraft
        __path__: /home/MCuser/minecraft/logs/latest.log
Note
You will need to add the Grafana Agent user as an owner of any custom log location you intend to collect from. For example, add the
grafana-agentuser to the groupadmwhich owns/var/syslog(the group name might be different on your system depending on your Linux distribution and the log location) like this:bashsudo usermod -a -G adm grafana-agent
Anytime you change the Grafana Agent configuration, you must restart Agent for the new configuration to take effect:
sudo systemctl restart grafana-agent.serviceTo check the status of Agent:
sudo systemctl status grafana-agent.service- For more details about the
logs_configblock in the Grafana Agent YAML configuration file, see Configure Grafana Agent. - For more examples and details about creating a Grafana Agent YAML configuration file, see Create a config file.
Confirm logs are being ingested into Grafana Cloud
Within several minutes, logs should begin to be available in Grafana Cloud. To test this, use the Explore feature.
To confirm that logs are being sent to Grafana Cloud:
Click Explore in the left sidebar menu to start.
This takes you to the Explore page.
At the top of the page, use the dropdown menu to select your Loki logs data source. This should be named
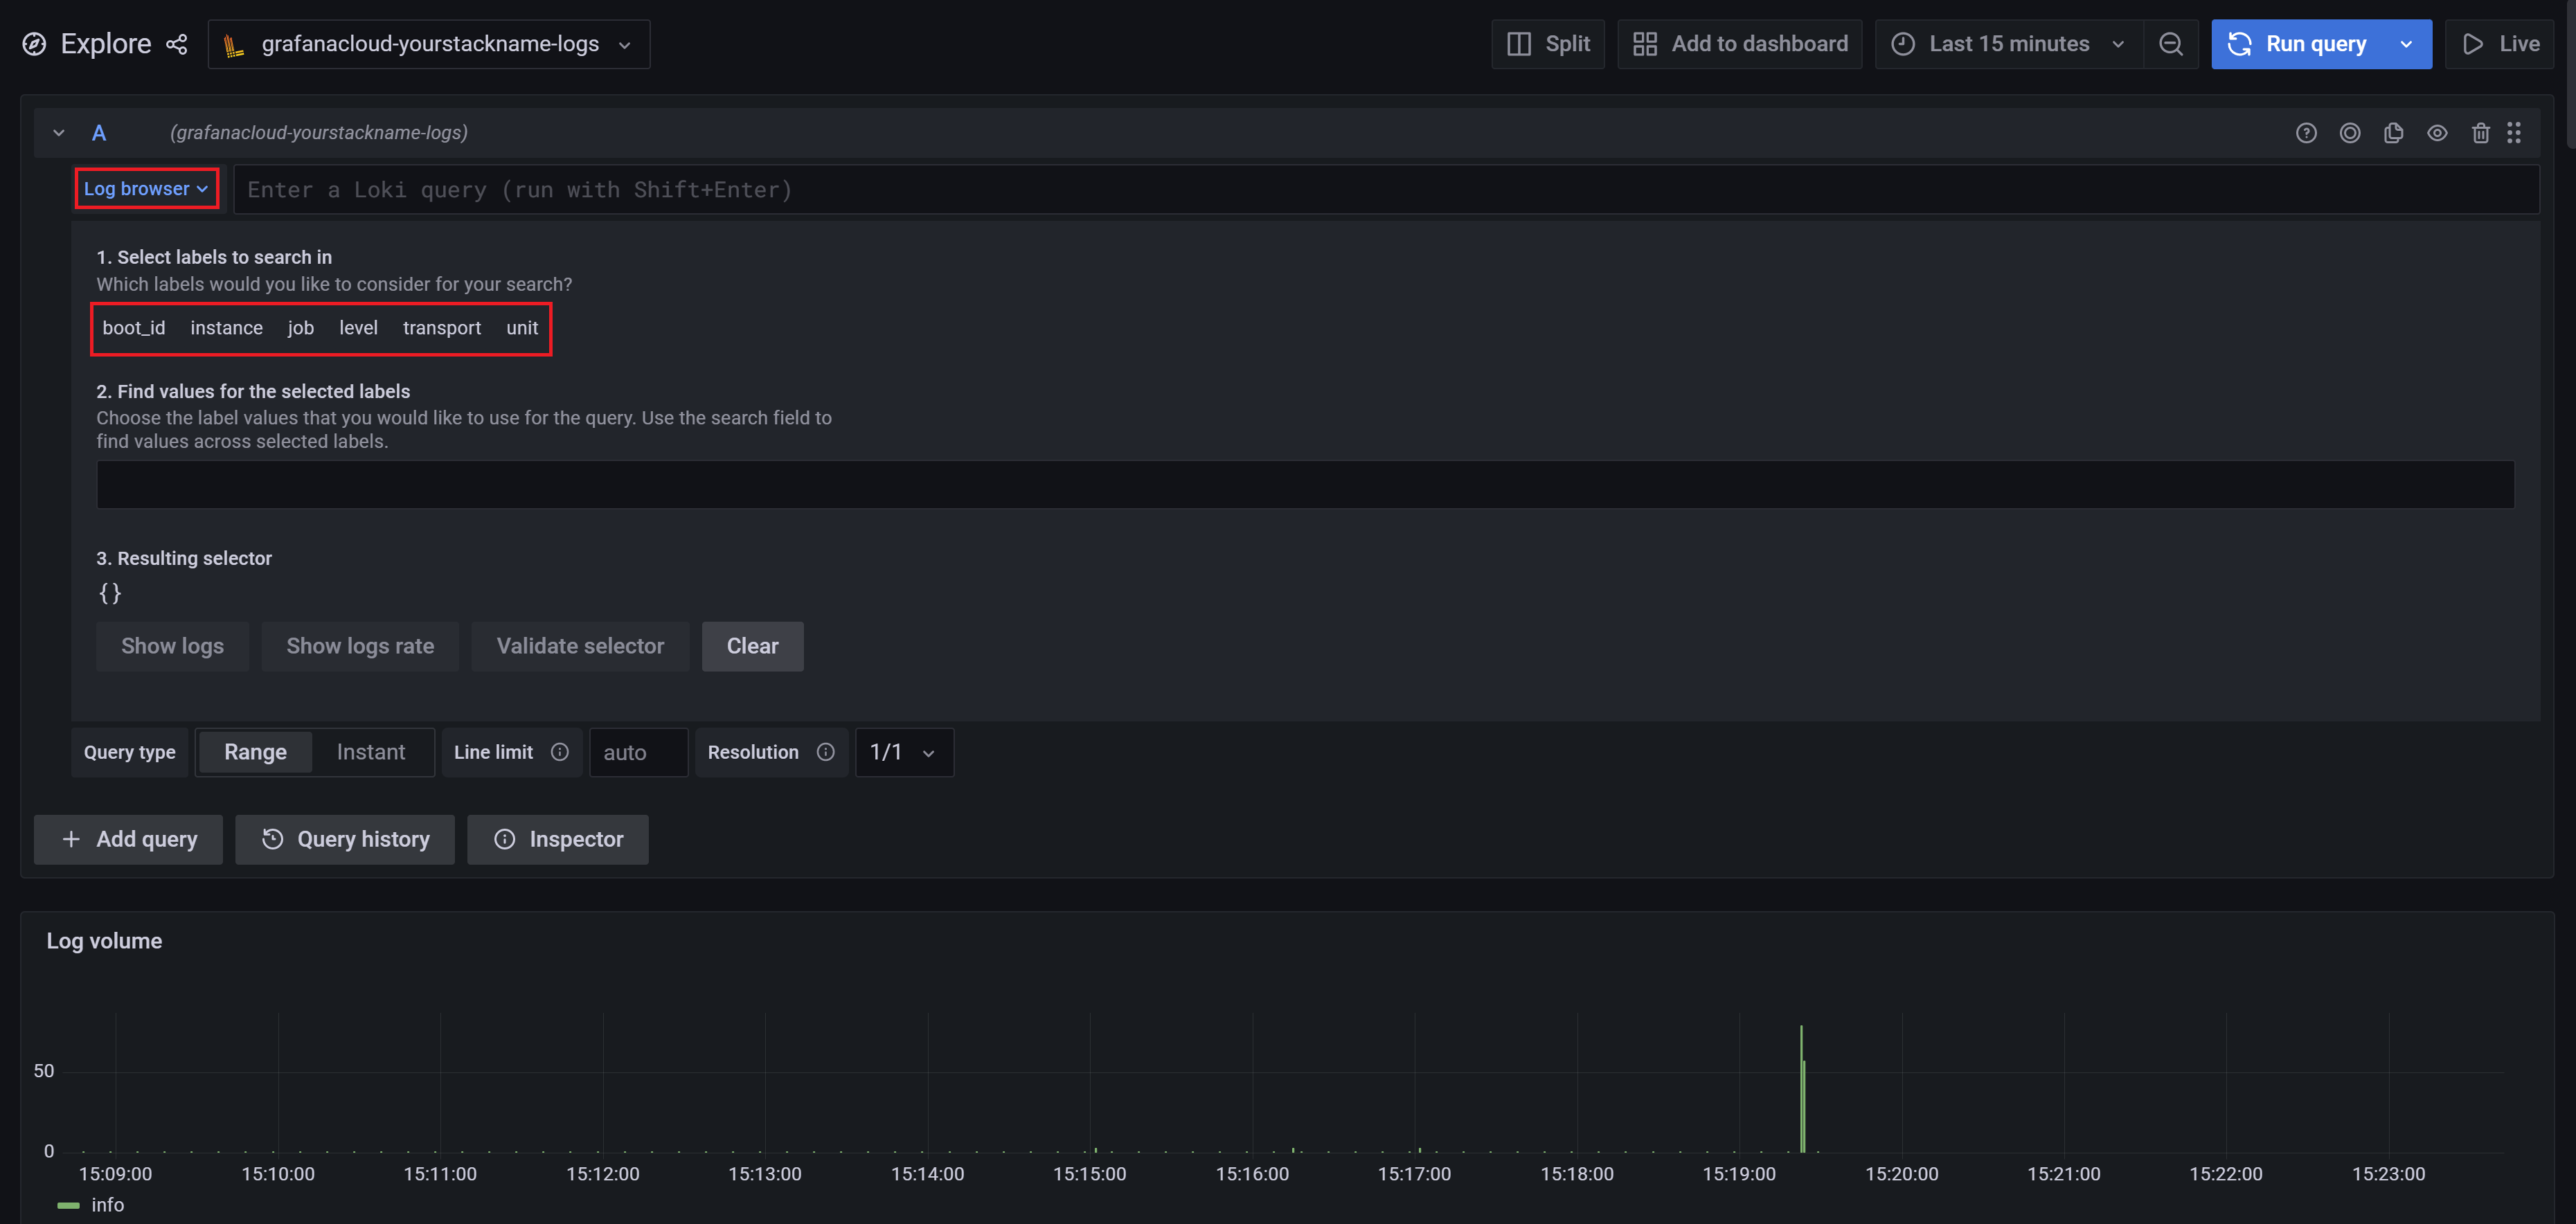
grafanacloud-$yourstackname-logs.The following image shows the Log browser dropdown used to find the labels for logs being ingested to your Grafana Cloud environment.
![Explore_Log_Browser_labels]()
If no log labels appear, logs are not being collected. If labels are listed, this confirms that logs are being received.
If logs are not displayed after several minutes, ensure Agent is running and check your steps for typos.
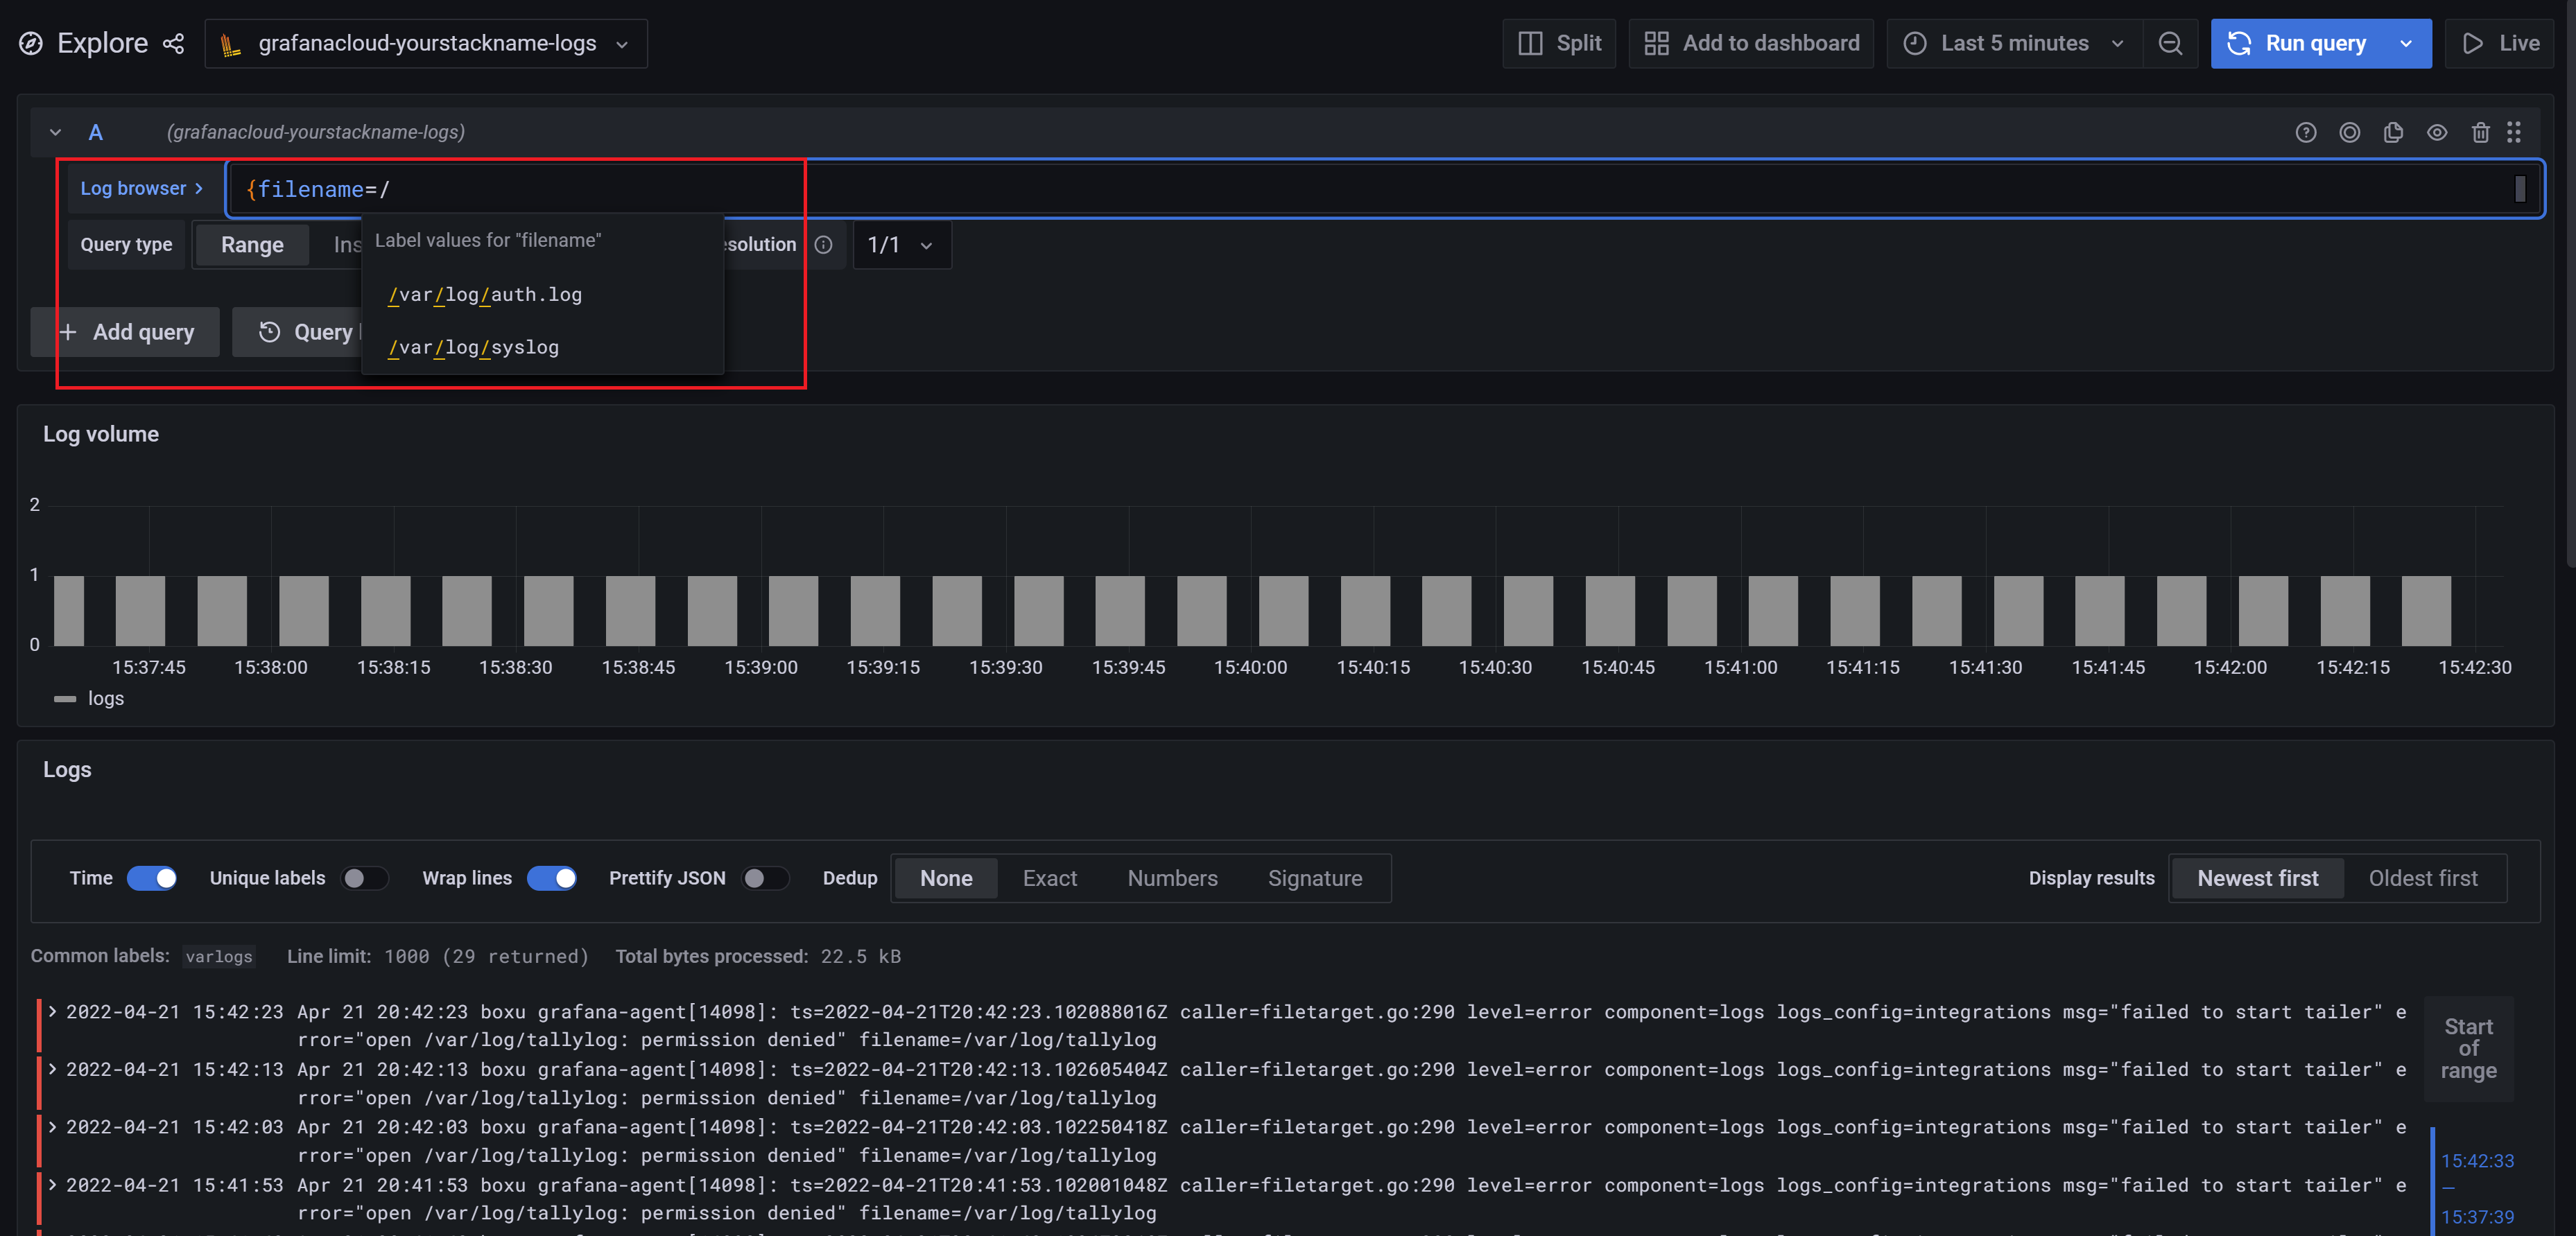
In addition to the Log browser dropdown, the Explore user interface also supports autocomplete options:

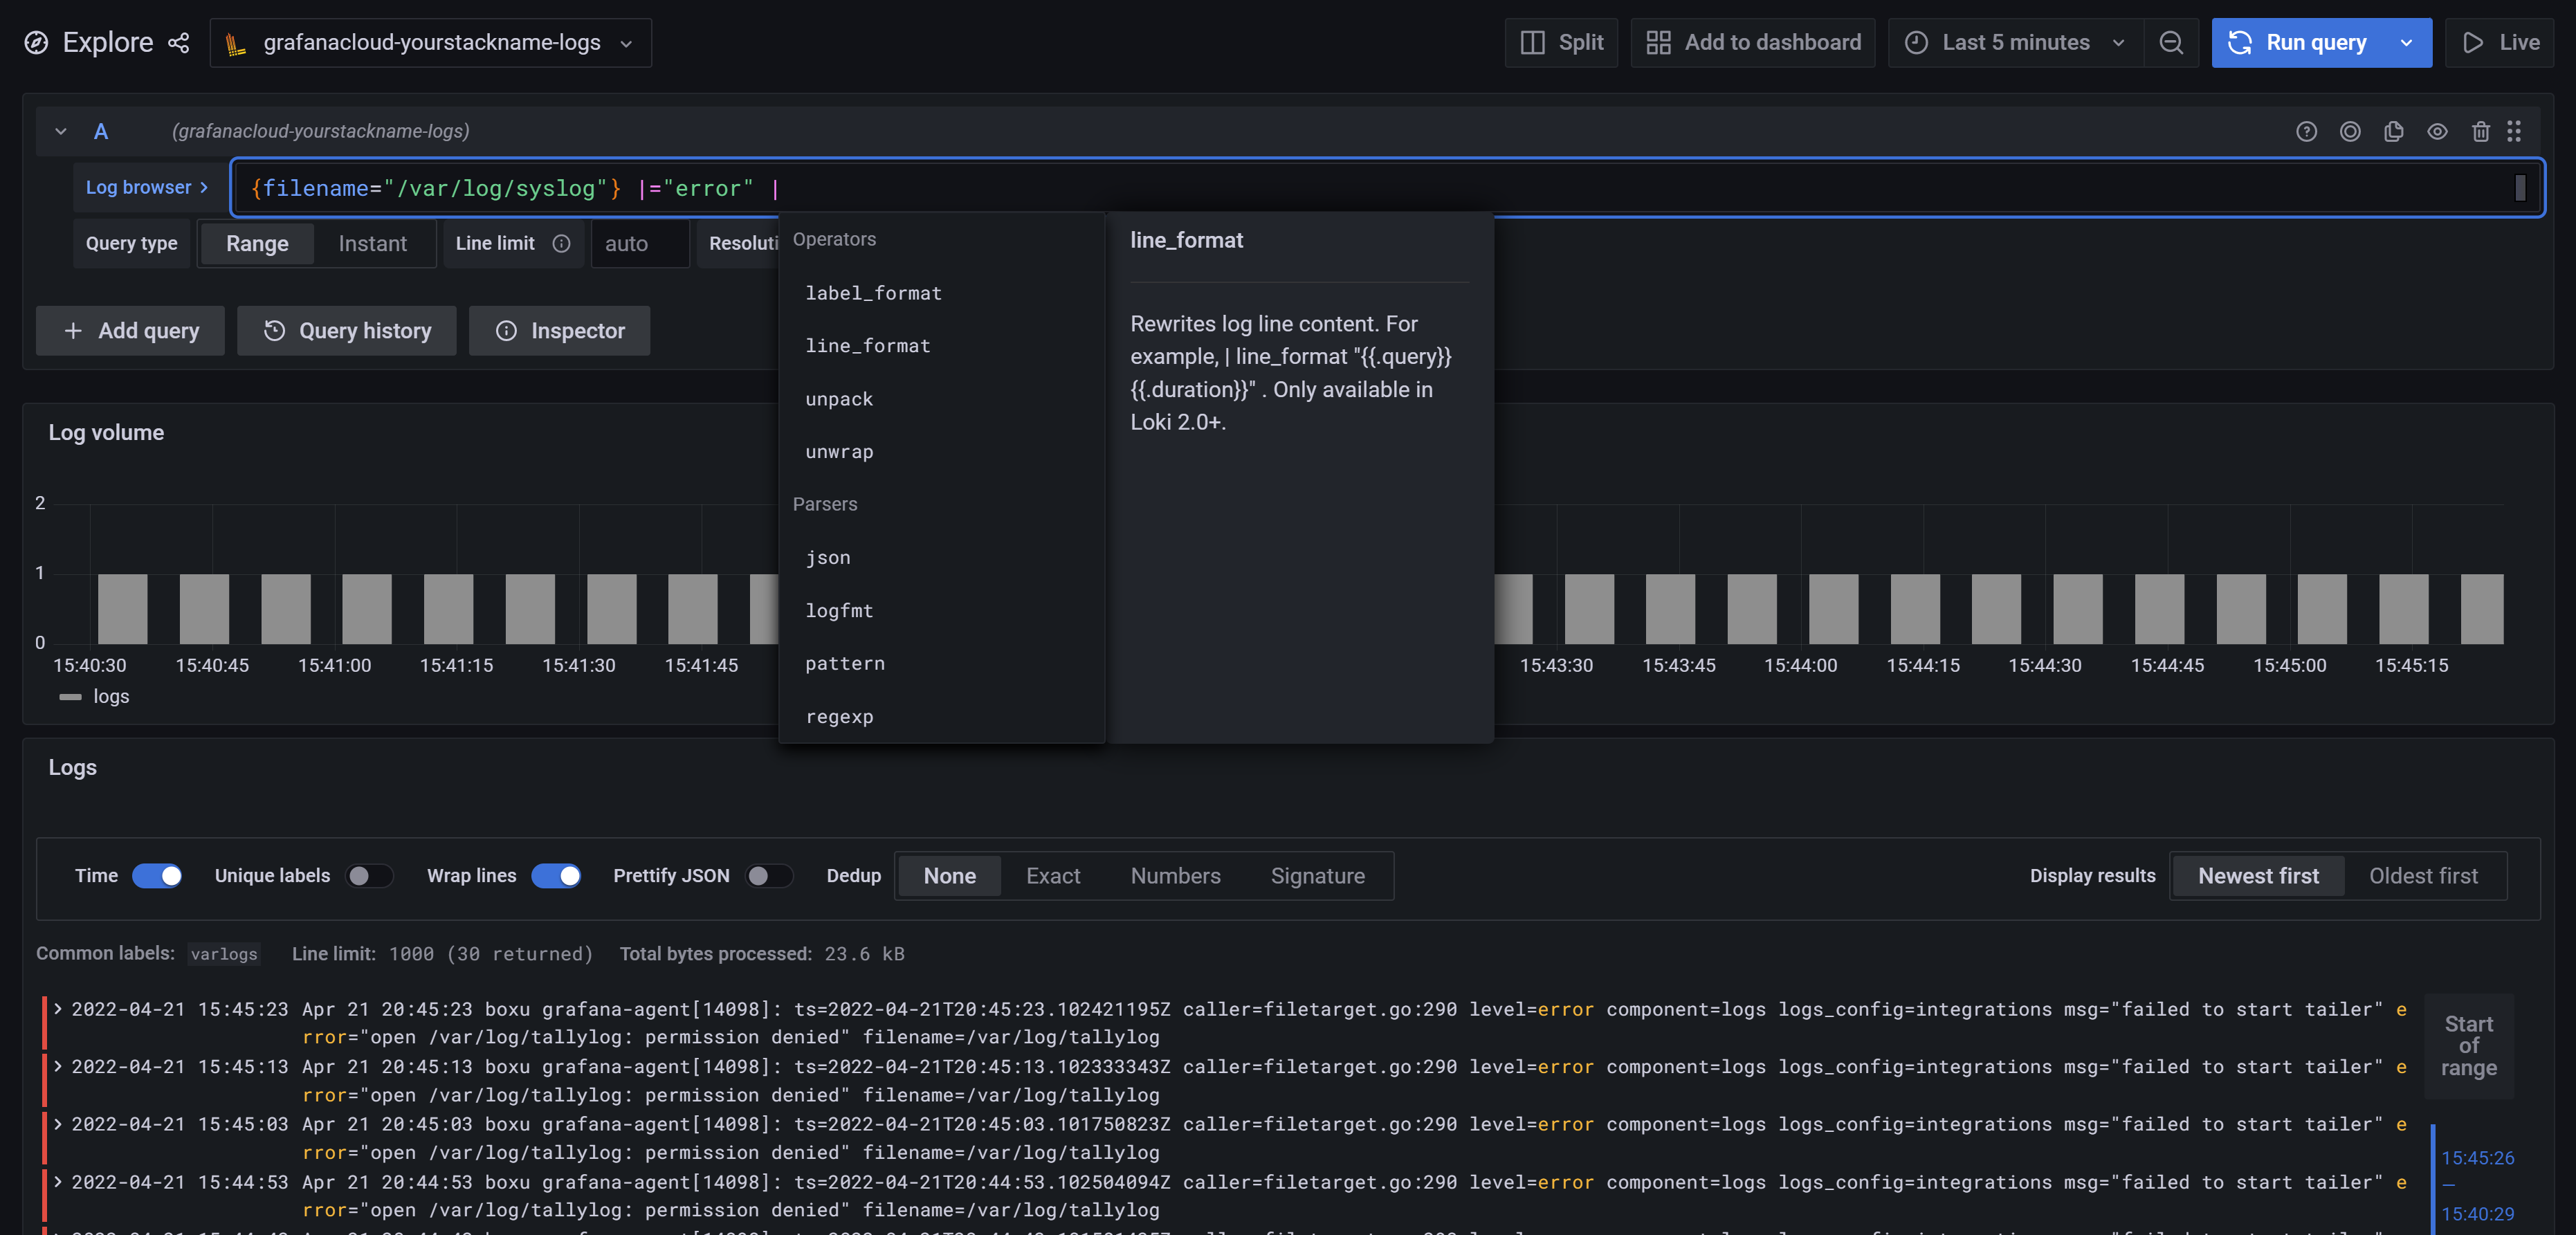
Below is another example of other operators and parsers available. For more details about querying log data, see LogQL: Log query language.

Query logs and create panels
Once you have Grafana Agent up and running on your log source, give it some time to start collecting logs. Eventually, you will be able to query logs and create panels inside dashboards using Loki as a datasource.
Querying logs is done using LogQL which can be used in both Explore and when creating dashboard panels.
For examples and feature showcases, check out play.grafana.org for ideas and inspiration.
Was this page helpful?
Related resources from Grafana Labs


